In this How To, you will learn: How to edit graphics, charts, and diagrams that are not automatically changed by data inputs on a separate excel document.
Covers tree diagram, bridge graphics, gear graphics, hexagon graphics, candlestick chart, hub & spoke, etc.
IMPORTANT NOTE: All graphic elements included with these PowerPoint styles are built inside PowerPoint and are all editable in tool.
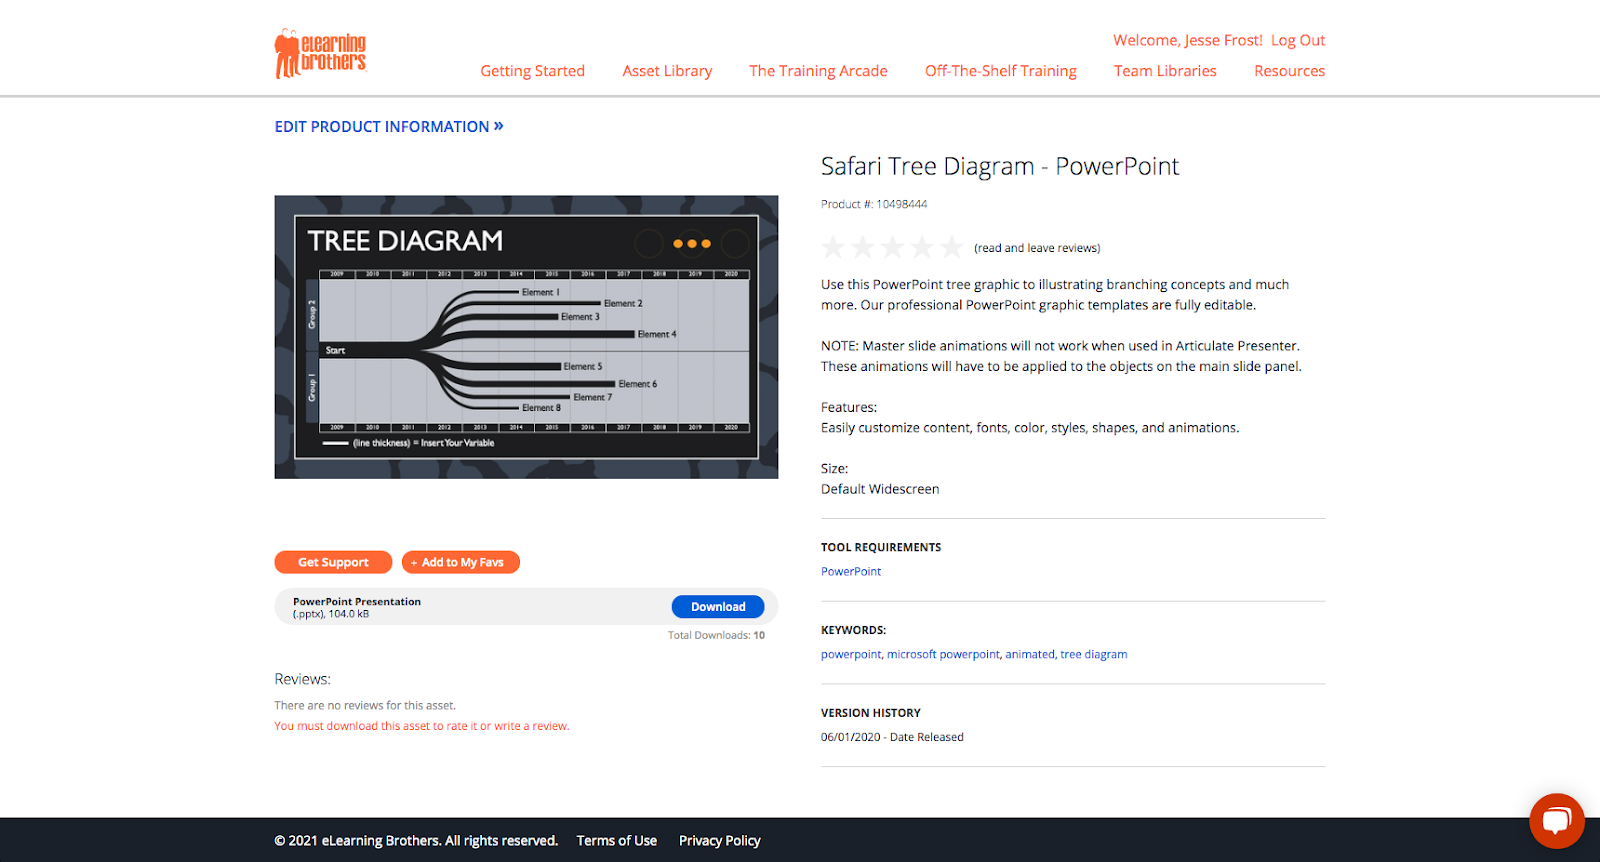
- Pick a style from the PowerPoint Library.
- Download files you wish to use.
- Open the file.
- Add your content by clicking on each text box, highlighting the copy and typing or pasting in your content.
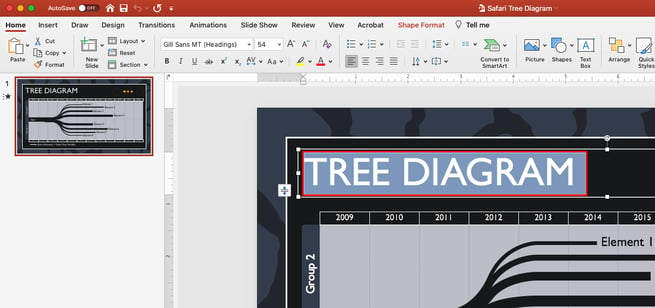
All text fields are editable in the filmstrip view.
To edit the branch lengths and thickness, select the branch that needs changed.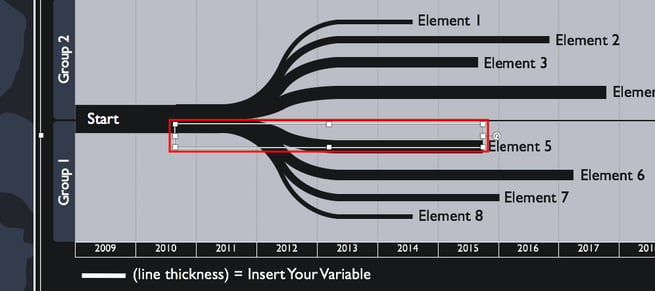
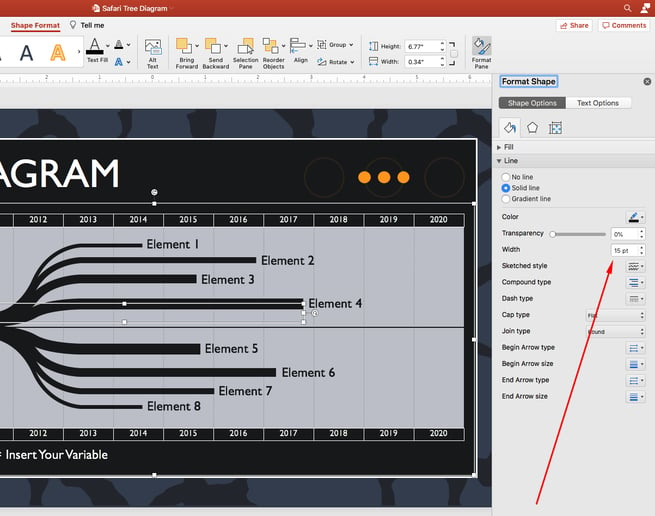
Change the thickness of branches by adjusting the Line Weight. Line weight can be found by selecting the Shape Format menu, and opening the Format Pane.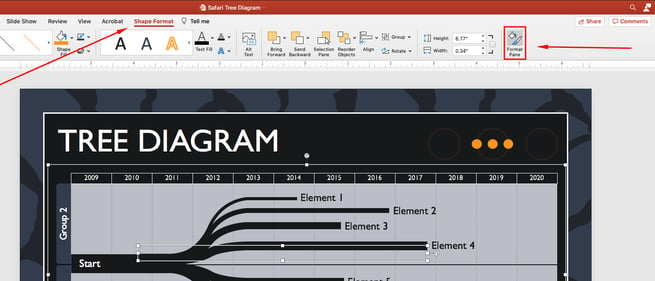
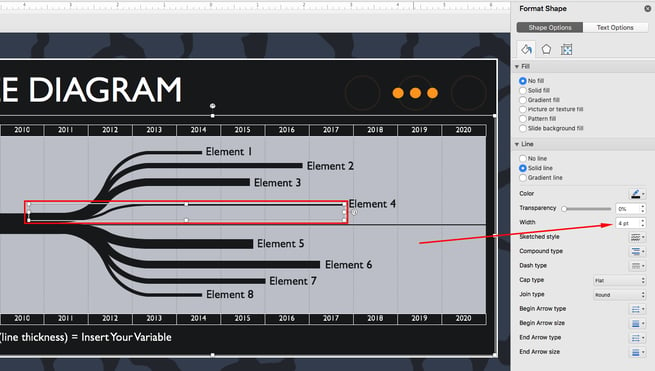
Change the depth of the curve by scaling the branches along one axis.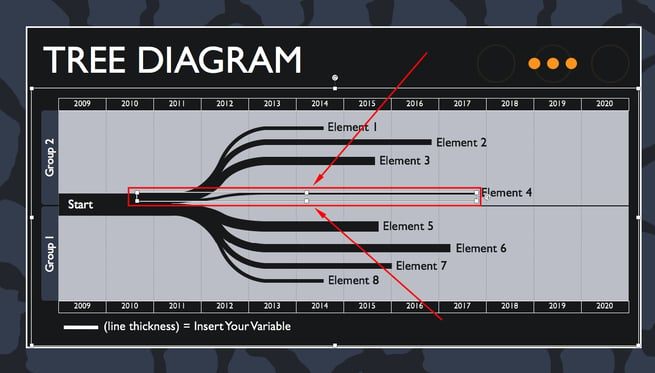
Change the length of the branch using “Edit Points” (select the end point and move it to the desired length). You can find Edit Points by selecting Shape Format › Edit Shape › Edit Points.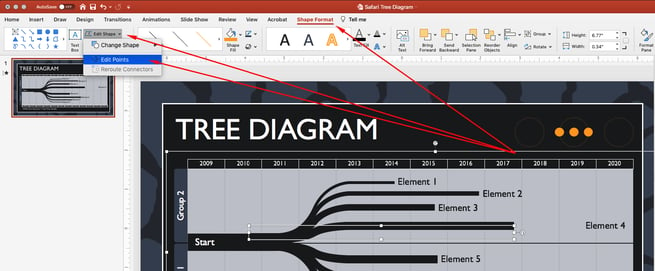
Select the end point and move it to the desired length.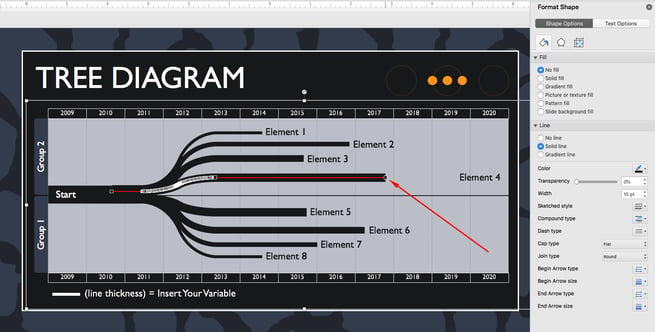
- You can make changes to the theme colors, theme fonts, create your own theme color pallet, and much more! For more information on that process follow these steps here ».
- When you finish adding your content and making changes to the graphic elements, be sure you save your file.
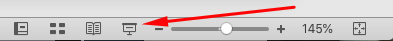
Pro Tip: Go back through your course/presentation in “presentation mode” to check that all your slides are in order and all of the content that you added is showing up properly.